Key Findings: BTC Technical Analysis
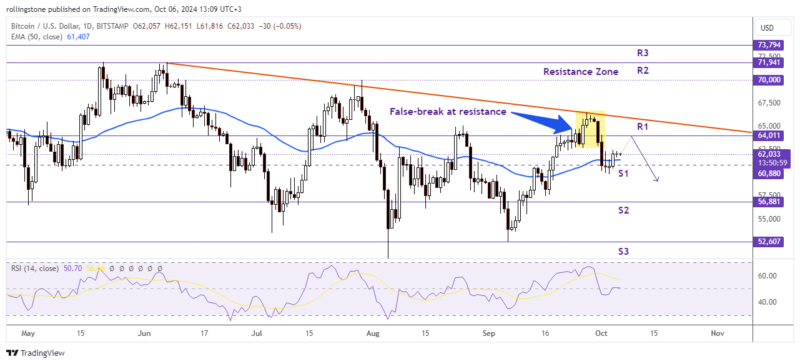
- The bitcoin price dropped around 6% last week following a rejection near the $66.5K level.
- A false break of the resistance at $64K escalated the bearish sentiment.
- BTC price rejecting key resistance but holding above the 50-EMA suggests a neutral market momentum.
Bitcoin Technical Analysis – BTC Daily Chart
 BTC/USD awaits a potential breakout of the $60K-$64K zone to decide the upcoming market bias. Source: The Distributed
After a three-week gain in September, Bitcoin’s weekly chart indicates that the largest cryptocurrency by market capitalization is now facing resistance above $64K after testing the descending trendline, having dropped more than 6% as of Friday.
This declining trendline, which was created by joining several weekly closes since the end of March, is a crucial resistance zone since it closely corresponds with the weekly resistance near $64,011. If Bitcoin keeps losing ground, it may drop much lower and retest the upcoming weekly support at $60,863, right below the 50-day Exponential Moving Average of $61,406.
The Relative Strength Index (RSI) is indecisive among traders as it lingers around its neutral level of 50. If the RSI drops much below its neutral level, the current slump might continue.
However, there are indications of a cooling from the recent sell-off on the daily chart. Bitcoin gained support on Wednesday near $60K, which is its 200-day EMA. It is trading above $61,500 as of Friday.
Bitcoin may rally to test its 61.8% Fibonacci retracement level, which is about $62,000, if this support holds. If it closes above it, the rally might continue heading towards $70,000.
See Related: Bitcoin And Ethereum Technical Analysis: BTC Could Test The Support At $60K Despite The Current Bullish Trend
Key Findings: ETH Technical Analysis
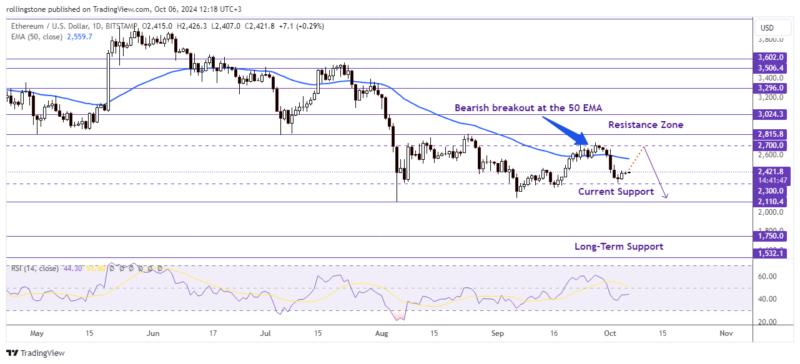
- Ethereum tested the support at $2.3K last week following a solid bearish breakout of the 50-EMA.
- Since the overall trend is still bearish, ETH might pull back near $2.7K before initiating another fresh bearish move.
- ETH/USD must survive the $2,300-$2,110 support zone to avoid a potential crash below the $2K zone.
Ethereum Technical Analysis – ETH Daily Chart
 ETH/USD might retest the critical support at $2,110 as the price rejects movements above the $2.7K resistance. Source: The Distributed
Ethereum rejected a move above the $2,700 level and eventually broke the dynamic support of the 50 EMA near $2,559 before making a strong bearish move around the current support at $2,300.
The RSI value dropping below 50 (currently at 44.11) indicates a bearish momentum. However, since the price encounters support near $2.3K, we might see ETH pullback near the $2.7K zone again before joining the overall downtrend.
Ethereum must break above the weekly resistance at $2,815 to establish bullish momentum and transform it into an uptrend. Alternatively, a bearish breakout of the $2,300 level might push the price below $2,110, initiating a long-term bearish trend.
The post Bitcoin And Ethereum Technical Analysis: BTC Momentum Remains Neutral Near $62K, ETH Eyes A Further Price Correction Following The 50-EMA Break appeared first on The Distributed.


