
Key Findings: BTC ($95,795.58) Technical Analysis
- Most signals show Bitcoin is falling, but it might slow down soon.
- If it falls below $93,000, it might go down to $80,000 or $73,000.
- If support holds, Bitcoin could rise to $100,000 or even a new high of $113,220.
Bitcoin Technical Analysis
 BTC/USD must hold above $93,000 to avoid a possible downtrend ahead. Source: The Distributed
Bitcoin is currently at $88,500, down 2.00% from the day’s trading. It ranged from $89,950 down to $87,950, down 11.5% from its all-time peak, but rising 0.63% from the low. A daily chart of the pair shows the pair is in a downtrend with 67.86% of the signals being bearish. The short-term indicators are neutral, indicating the slowing down of the ongoing downswing.
If Bitcoin doesn’t hit the $90,000 level, the asset is expected to fall down toward $87,000 as the month ends. Current projections indicate the price is expected to oscillate in the support level of $93,000 to $108,000. $93,000 is being repeatedly challenged, and a fall from here can see the asset fall rapidly down toward $80,000, or even down toward $73,000. However, with the support being found, the bounce toward $100,000 or even a new all-time peak at $113,220 is also quite plausible.
Traders must be careful, considering the current uncertainty in the market. The rise in open interest, combined with high volume, indicates the potential for a big price movement. Bitcoin is at a turning point now, and its future will determine whether it can continue its bullish trend or face further corrections.
See Related: Bitcoin, Ethereum Technical Analysis; BTC At Risk Of Hitting $23,500, But ETH ($2,813.58) Still Holds Above The Support At $1,838
Key Findings: ETH Technical Analysis
- Ethereum is forming lower highs and lows, with the possibility of going below $2,500 and, maybe, touching $2,350 or $2,135.
- A breach above $2,700 could signal a change of heart, sending ETH to $2,865 and beyond.
- Investors are cautious due to regulatory concerns and the upcoming Ethereum Dencun upgrade, which can affect price volatility.
Ethereum Technical Analysis
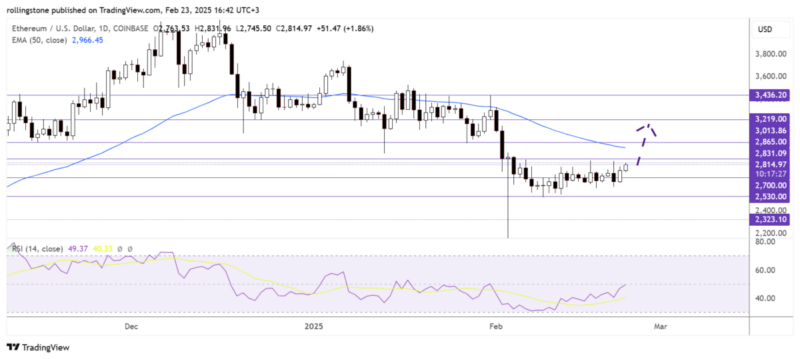 ETH/USD shows bullish momentum while consolidating below the $2,865 support. Source: The Distributed
Ethereum (ETH) stands at $2,550 today, down 1.8%, with support and resistance at $2,530–$2,575. The price is forming lower highs and lows, which points to a bearish trend.
If ETH goes below $2,500, it could go down to $2,350 or even $2,135. Breaking the $2,700 level would be required to record a bullish reversal, taking the price up to $2,865 and beyond.
Sentiment remains muted with impending regulation announcements and the Ethereum Dencun updates in view. Investors ought to keep in sight pivotal supports and resistances to monitor impending volatility.
The post Bitcoin And Ethereum Technical Analysis: BTC On Edge, Will $93K Hold Or Collapse? ETC ($20.68) Struggles Below $2,600, Can It Rebound? appeared first on The Distributed.


