The post Will Shiba Inu Take A 46% Breakout Route to $0.000025? appeared first on Coinpedia Fintech News
With a bullish failure to regain a decisive rally, the top meme coins are facing massive overhead supply pressure. Amid the bear market, Shiba Inu price action reveals a constant struggle to overcome the bearish influence.
Will the second biggest meme coin in the crypto space manage to kickstart a breakout rally? Read this SHIB price analysis for more details.
Shiba Inu Price Performance
With a market cap of $10.05 billion, the Shiba Inu token is currently trading at $0.00001706. In the past 24 hours, the SHIB meme coin has dropped by 2.80%.

Tradingview
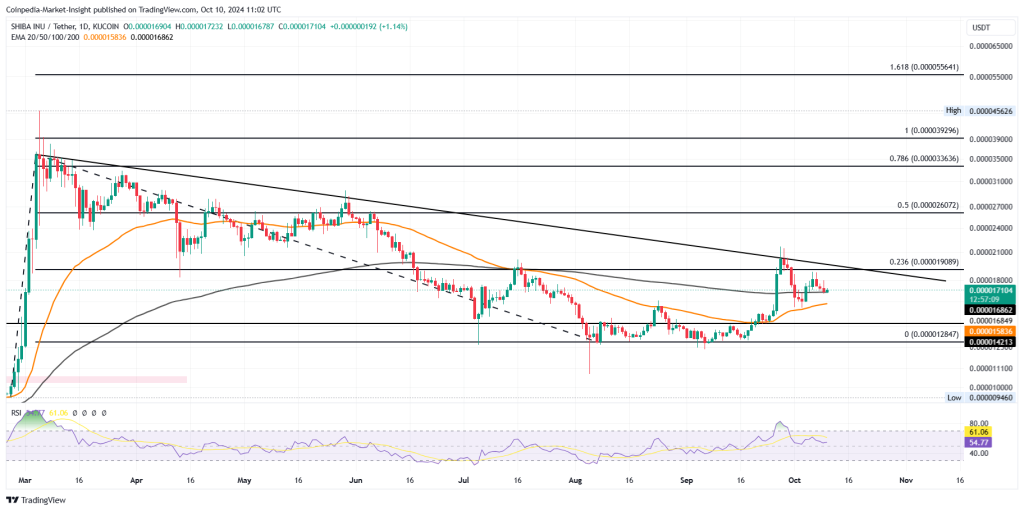
In the daily chart, the Shiba Inu price action reveals a major overhead resistance trendline, keeping the bullish growth in check. Currently, the recent bear cycle from the overhead trendline took support at the 50-day EMA before forming a bullish engulfing candle of 8.21% on October 4.
Technical indicators:
RSI: The daily RSI line reveals a sideways trend slightly above the halfway line, ready for a bullish reversal.
EMA: The gradual rise in bullish influence teases a golden crossover between the 50-day and 200-day EMA. Hence, the momentum indicator reveals a surge in buying pressure.
Will SHIB Price Reclaim $0.000025?
The recovery rally failed to surpass the 23.60% Fibonacci level at $0.00001908, resulting in a pullback to the 200-day EMA. Currently, it is trading with an intraday gain of 1.22%, sustaining dominance above the 200-day EMA.
Hence, the technical indicators are projecting a bullish possibility. Based on the Fibonacci levels, the trendline breakout will likely result in a price jump to the 50% or 78.60% Fibonacci level at $0.000026 or $0.000033, respectively.
On the flip side, the crucial supports are present at the 50-day EMA at $0.00001583 and $0.00001421 support levels.
Curious to know if Shiba Inu will make a bullish comeback? Read Coinpedia’s SHIB price prediction to find out the next bullish targets!


